Linearly interpolate values between two thresholds.
Usage
linear_interpolation(
  x,
  coordinate_one_x,
  coordinate_one_y,
  coordinate_two_x,
  coordinate_two_y
)Details
Values are log-linearly interpolated at the x-coordinates
specified in x based on a line defined by the other parameters.
Values that are smaller than or greater than coordinate_one_x and
coordinate_two_x are assigned values equal to
coordinate_one_y and coordinate_two_y (respectively).
In other words, this function does not extrapolate values.
Examples
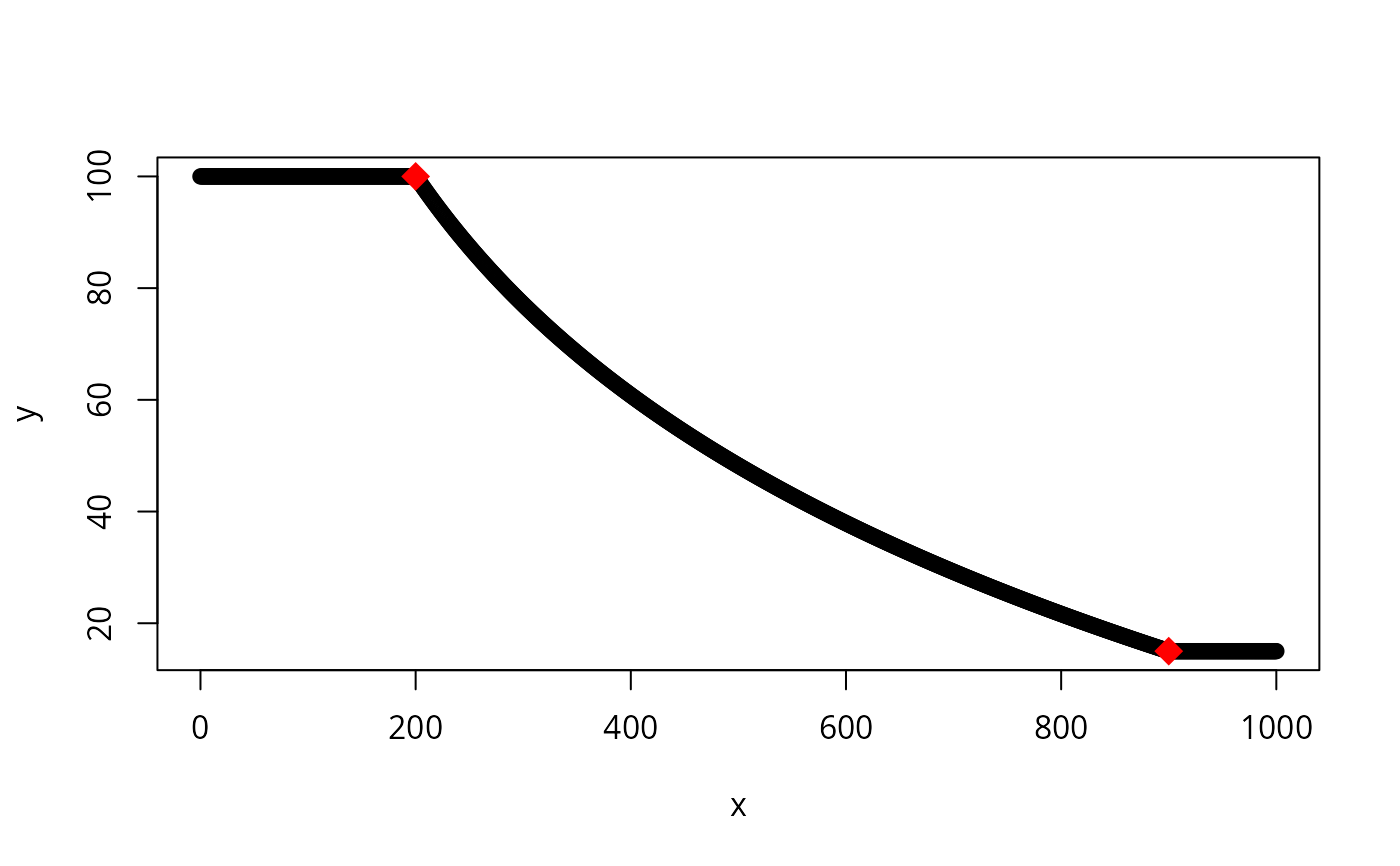
# create series of x-values
x <- seq(0, 1000)

# interpolate y-values for the x-values given the two reference points:
# (200, 100) and (900, 15)
y <- loglinear_interpolation(x, 200, 100, 900, 15)

# plot the interpolated values
plot(y ~ x)

# add the reference points to the plot (shown in red)
points(x = c(200, 900), y = c(100, 15), pch = 18, col = "red", cex = 2)