Specify targets expressed as a proportion (between 0 and 1) of the maximum
level of representation of each feature in the study area.
Please note that proportions
are scaled according to the features' total abundances in the study area
(including any locked out planning units, or planning units with NA
cost values) using the feature_abundances() function.
Note that this function is designed to be used with add_auto_targets()
and add_group_targets().
Value
An object (TargetMethod) for specifying targets that
can be used with add_auto_targets() and add_group_targets()
to add targets to a problem().
Mathematical formulation
This method involves setting target thresholds based on a proportion.
To express this mathematically, we will define the following terminology.
Let \(f\) denote the total abundance of a feature (e.g., geographic
range size), and \(a\) the relative target for the feature
(per targets).
Given this terminology, the target threshold (\(t\)) for the feature
is calculated as follows.
$$t = f \times a$$
See also
To add relative targets directly to a problem(), see
add_relative_targets().
Other target setting methods:
spec_absolute_targets(),
spec_area_targets(),
spec_duran_targets(),
spec_interp_absolute_targets(),
spec_interp_area_targets(),
spec_jung_targets(),
spec_max_targets(),
spec_min_targets(),
spec_polak_targets(),
spec_pop_size_targets(),
spec_rl_ecosystem_targets(),
spec_rl_species_targets(),
spec_rodrigues_targets(),
spec_rule_targets(),
spec_sreekar_targets(),
spec_ward_targets(),
spec_watson_targets(),
spec_wilson_targets()
Examples
# set seed for reproducibility
set.seed(500)
# load data
sim_complex_pu_raster <- get_sim_complex_pu_raster()
sim_complex_features <- get_sim_complex_features()
# create base problem
p0 <-
problem(sim_complex_pu_raster, sim_complex_features) %>%
add_min_set_objective() %>%
add_binary_decisions() %>%
add_default_solver(verbose = FALSE)
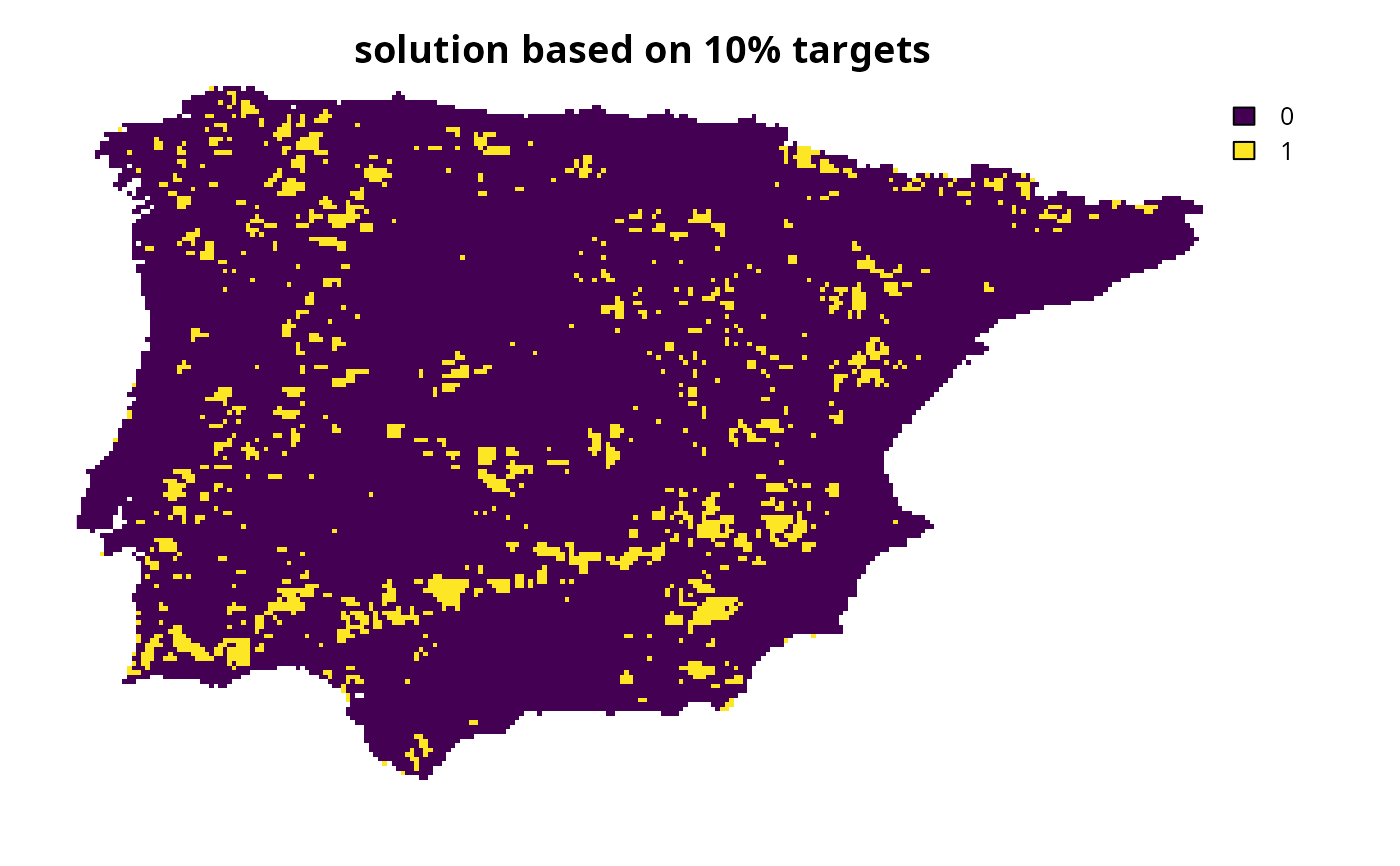
# create problem with targets of 10% for each feature
p1 <-
p0 %>%
add_auto_targets(method = spec_relative_targets(targets = 0.1))
# solve problem
s1 <- solve(p1)
# plot solution
plot(s1, main = "solution based on 10% targets", axes = FALSE)
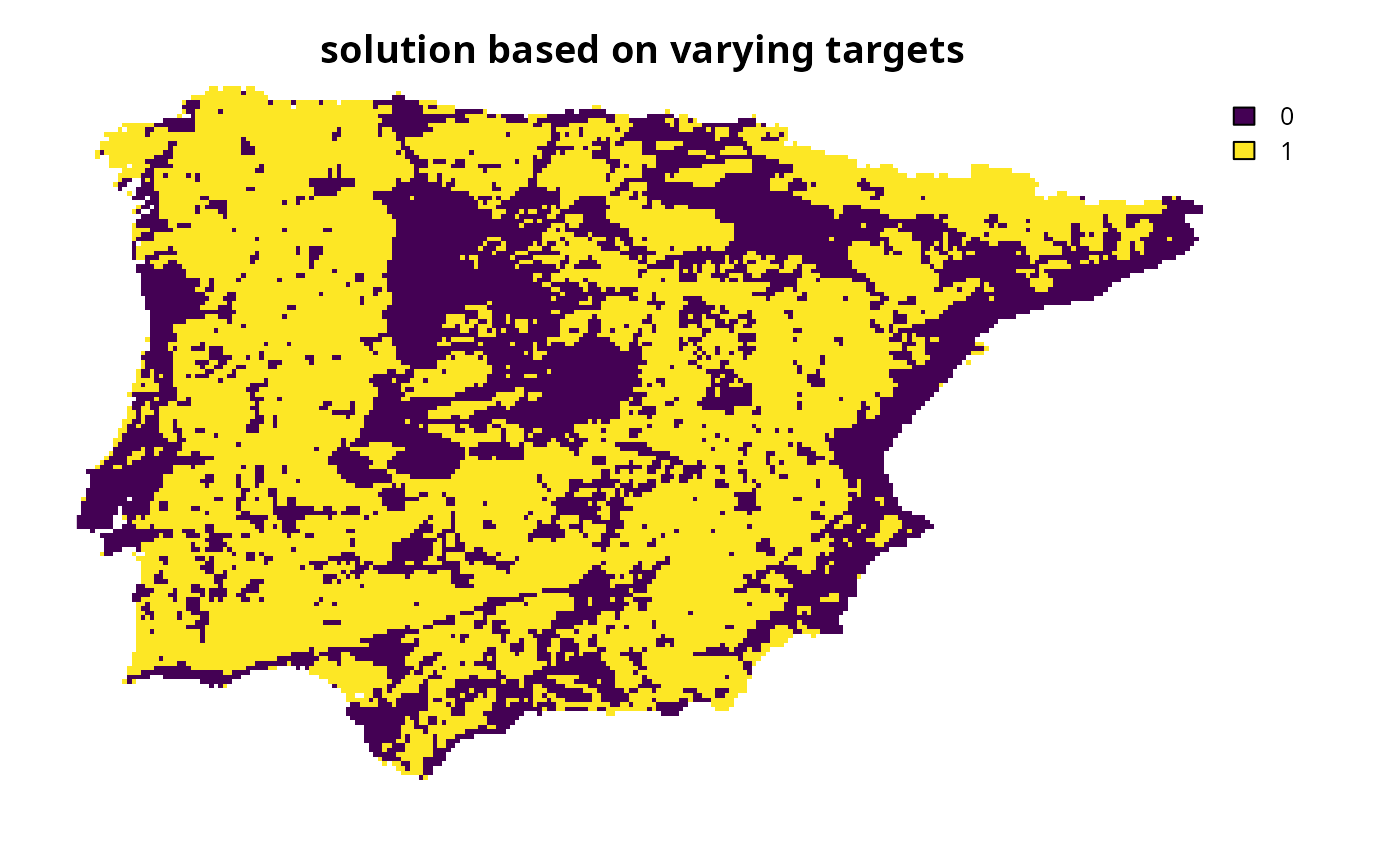
 # targets can also be specified for each feature separately.
# to demonstrate this, we will set a target value for each
# feature based on a random percentage between 10% and 80%
target_values <- runif(terra::nlyr(sim_complex_features), 0.1, 0.8)
# create problem with targets defined separately for each feature
p2 <-
p0 %>%
add_auto_targets(method = spec_relative_targets(targets = target_values))
# solve problem
s2 <- solve(p2)
# plot solution
plot(s2, main = "solution based on varying targets", axes = FALSE)
# targets can also be specified for each feature separately.
# to demonstrate this, we will set a target value for each
# feature based on a random percentage between 10% and 80%
target_values <- runif(terra::nlyr(sim_complex_features), 0.1, 0.8)
# create problem with targets defined separately for each feature
p2 <-
p0 %>%
add_auto_targets(method = spec_relative_targets(targets = target_values))
# solve problem
s2 <- solve(p2)
# plot solution
plot(s2, main = "solution based on varying targets", axes = FALSE)