Generate a portfolio of solutions for a conservation planning problem by finding a pre-specified number of solutions that are closest to optimality (i.e, the top solutions).
Arguments
- x
problem()object.- number_solutions
integervalue denoting the number of required solutions. Defaults to 10.
Value
An updated problem() object with the portfolio added to it.
Details
This strategy for generating a portfolio requires problems to
be solved using the Gurobi software (i.e., using
add_gurobi_solver(). Specifically, version 8.0.0 (or greater)
of the gurobi package must be installed.
Note that the number of solutions returned may be less than
number_solutions, because the total number of feasible solutions
may be fewer than number_solutions.
See also
Other functions for adding portfolios:
add_cuts_portfolio(),
add_default_portfolio(),
add_extra_portfolio(),
add_gap_portfolio(),
add_shuffle_portfolio(),
add_single_portfolio()
Examples
# set seed for reproducibility
set.seed(600)
# load data
sim_pu_raster <- get_sim_pu_raster()
sim_features <- get_sim_features()
sim_zones_pu_raster <- get_sim_zones_pu_raster()
sim_zones_features <- get_sim_zones_features()
# create minimal problem with a portfolio for the top 5 solutions
p1 <-
problem(sim_pu_raster, sim_features) %>%
add_min_set_objective() %>%
add_relative_targets(0.05) %>%
add_top_portfolio(number_solutions = 5) %>%
add_default_solver(gap = 0, verbose = FALSE)
# solve problem and generate portfolio
s1 <- solve(p1)
# convert portfolio into a multi-layer raster
s1 <- terra::rast(s1)
# print number of solutions found
print(terra::nlyr(s1))
#> [1] 5
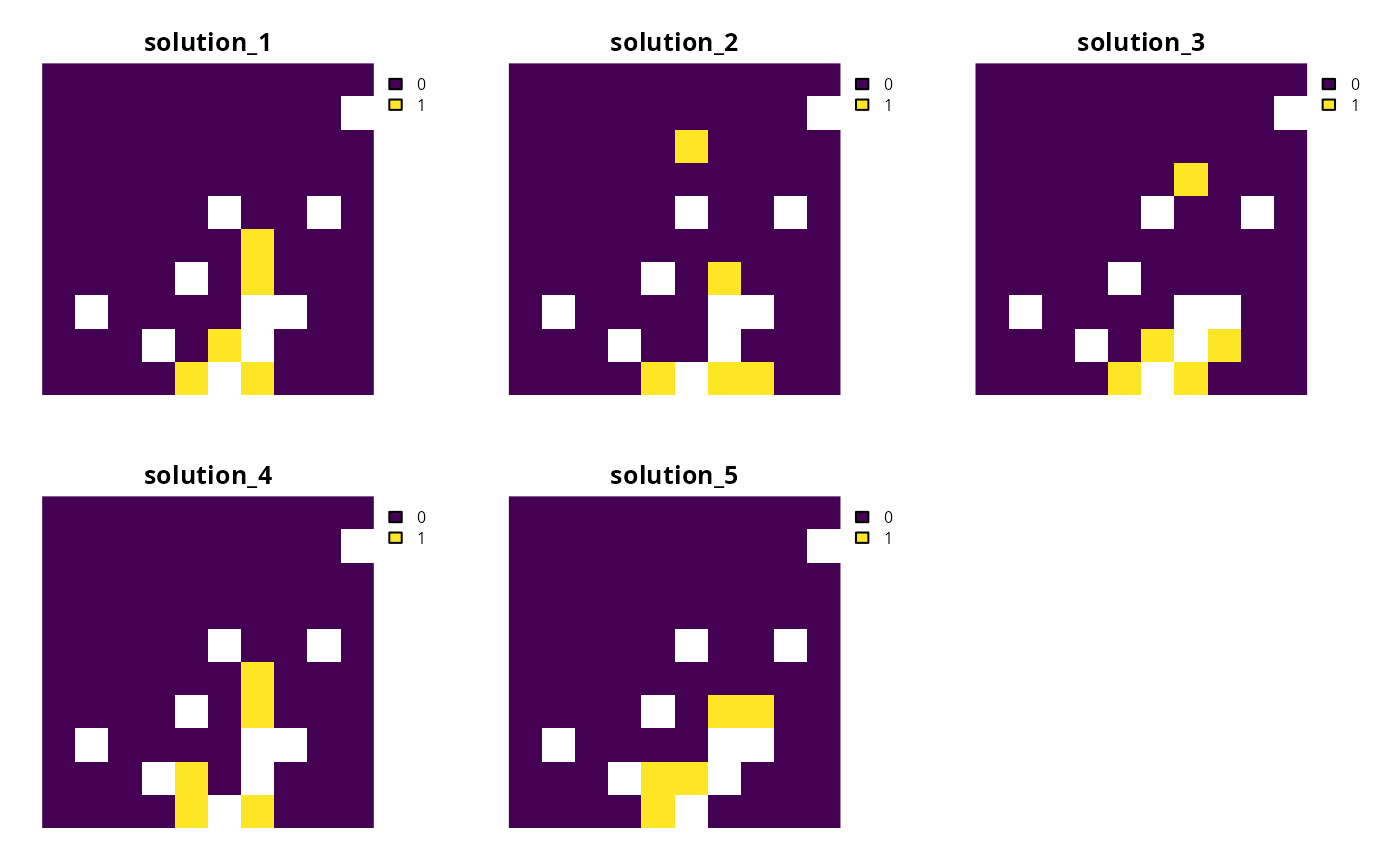
# plot solutions
plot(s1, axes = FALSE)
 # create multi-zone problem with a portfolio for the top 5 solutions
p2 <-
problem(sim_zones_pu_raster, sim_zones_features) %>%
add_min_set_objective() %>%
add_relative_targets(matrix(runif(15, 0.1, 0.2), nrow = 5, ncol = 3)) %>%
add_top_portfolio(number_solutions = 5) %>%
add_default_solver(gap = 0, verbose = FALSE)
# solve problem and generate portfolio
s2 <- solve(p2)
# convert each solution in the portfolio into a single category layer
s2 <- terra::rast(lapply(s2, category_layer))
# print number of solutions found
print(terra::nlyr(s2))
#> [1] 5
# plot solutions in portfolio
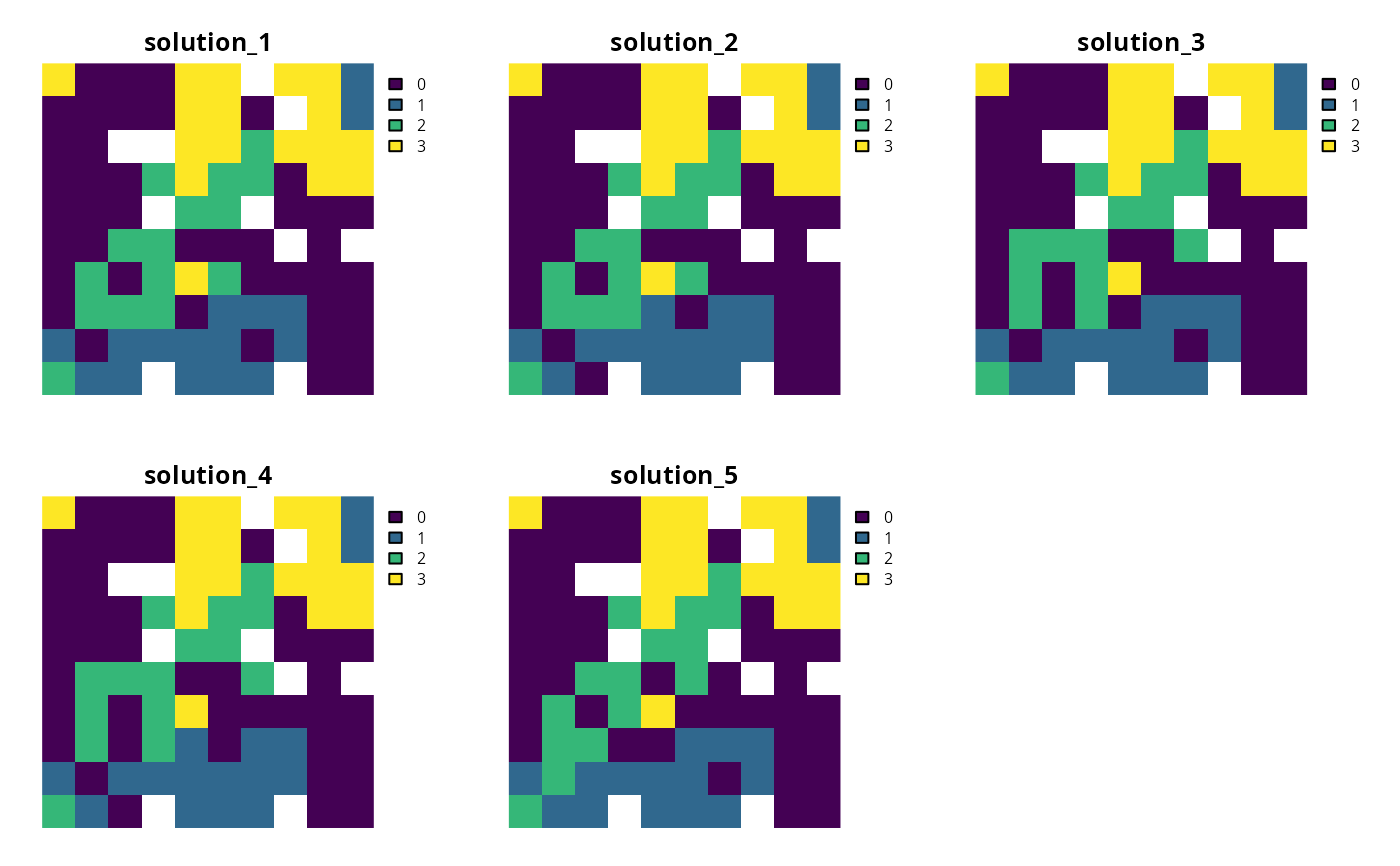
plot(s2, axes = FALSE)
# create multi-zone problem with a portfolio for the top 5 solutions
p2 <-
problem(sim_zones_pu_raster, sim_zones_features) %>%
add_min_set_objective() %>%
add_relative_targets(matrix(runif(15, 0.1, 0.2), nrow = 5, ncol = 3)) %>%
add_top_portfolio(number_solutions = 5) %>%
add_default_solver(gap = 0, verbose = FALSE)
# solve problem and generate portfolio
s2 <- solve(p2)
# convert each solution in the portfolio into a single category layer
s2 <- terra::rast(lapply(s2, category_layer))
# print number of solutions found
print(terra::nlyr(s2))
#> [1] 5
# plot solutions in portfolio
plot(s2, axes = FALSE)